📊 Click here to jump to the industry research section
“Are customers ready for this?
It’s one of the questions we field most from our utility partners. The question makes sense: rebate participation is generally underwhelming, adoption of payment portals can be low, and sometimes it takes a hundred-year drought and fines to convince customers to conserve. What signs are there that customers would use a portal?
For better or for worse, these reservations are founded on past customer behavior – behavior in a non-digital era when water wasn’t metered and billed at a flat rate. Today’s utility customers, riding the waves of modern technology, have different expectations, different values, and different tools than their predecessors.
Let’s take a look at recent macro trends we’ve seen in customer expectations:
Not only do I want to send a package, but I want to track it too.
Not only do I want a credit card, but I want to be notified as I approach my credit limit
Not only do I want to fly, but I want to check in on my phone and not print boarding passes
Brands and service providers like banks, credit cards, and even the U.S. Postal Service have long adopted digital “tools and services” to satisfy customers and build brand loyalty. Organizations had to adopt these new models of customer service and this rising tide lifted customer expectations for everyone. Relationships, now online, are two-way and always on.
Meanwhile, the water utility playbook – focused on delivery – has stayed relatively consistent. And customers, who take it for granted that water will always come out of the faucet, haven’t traditionally thought about their utility until there’s an issue; so communication between the two parties has generally been limited to moments of dissatisfaction.
In today’s digital age, customer perception of their utility goes beyond the traditional metrics of quality, reliability, and price. The ability to communicate openly, quickly, and transparently shapes customer perception more than traditional metrics. Furthermore, this type of communication gives utilities the opportunity to proactively tell their story in ways that help customers understand the value of their services.
So, the questions make sense:
“Are customers ready for digital access?”
“Would customers find value in a portal?”
“What does this mean for our utility?”
Below we’ll lean on some of the supporting data that indicate utility customers are not only ready, but desire a digital portal. Questions? Shoot them our way anytime at hello@dropcountr.com
What does the data tell us about how consumers use their mobile device?
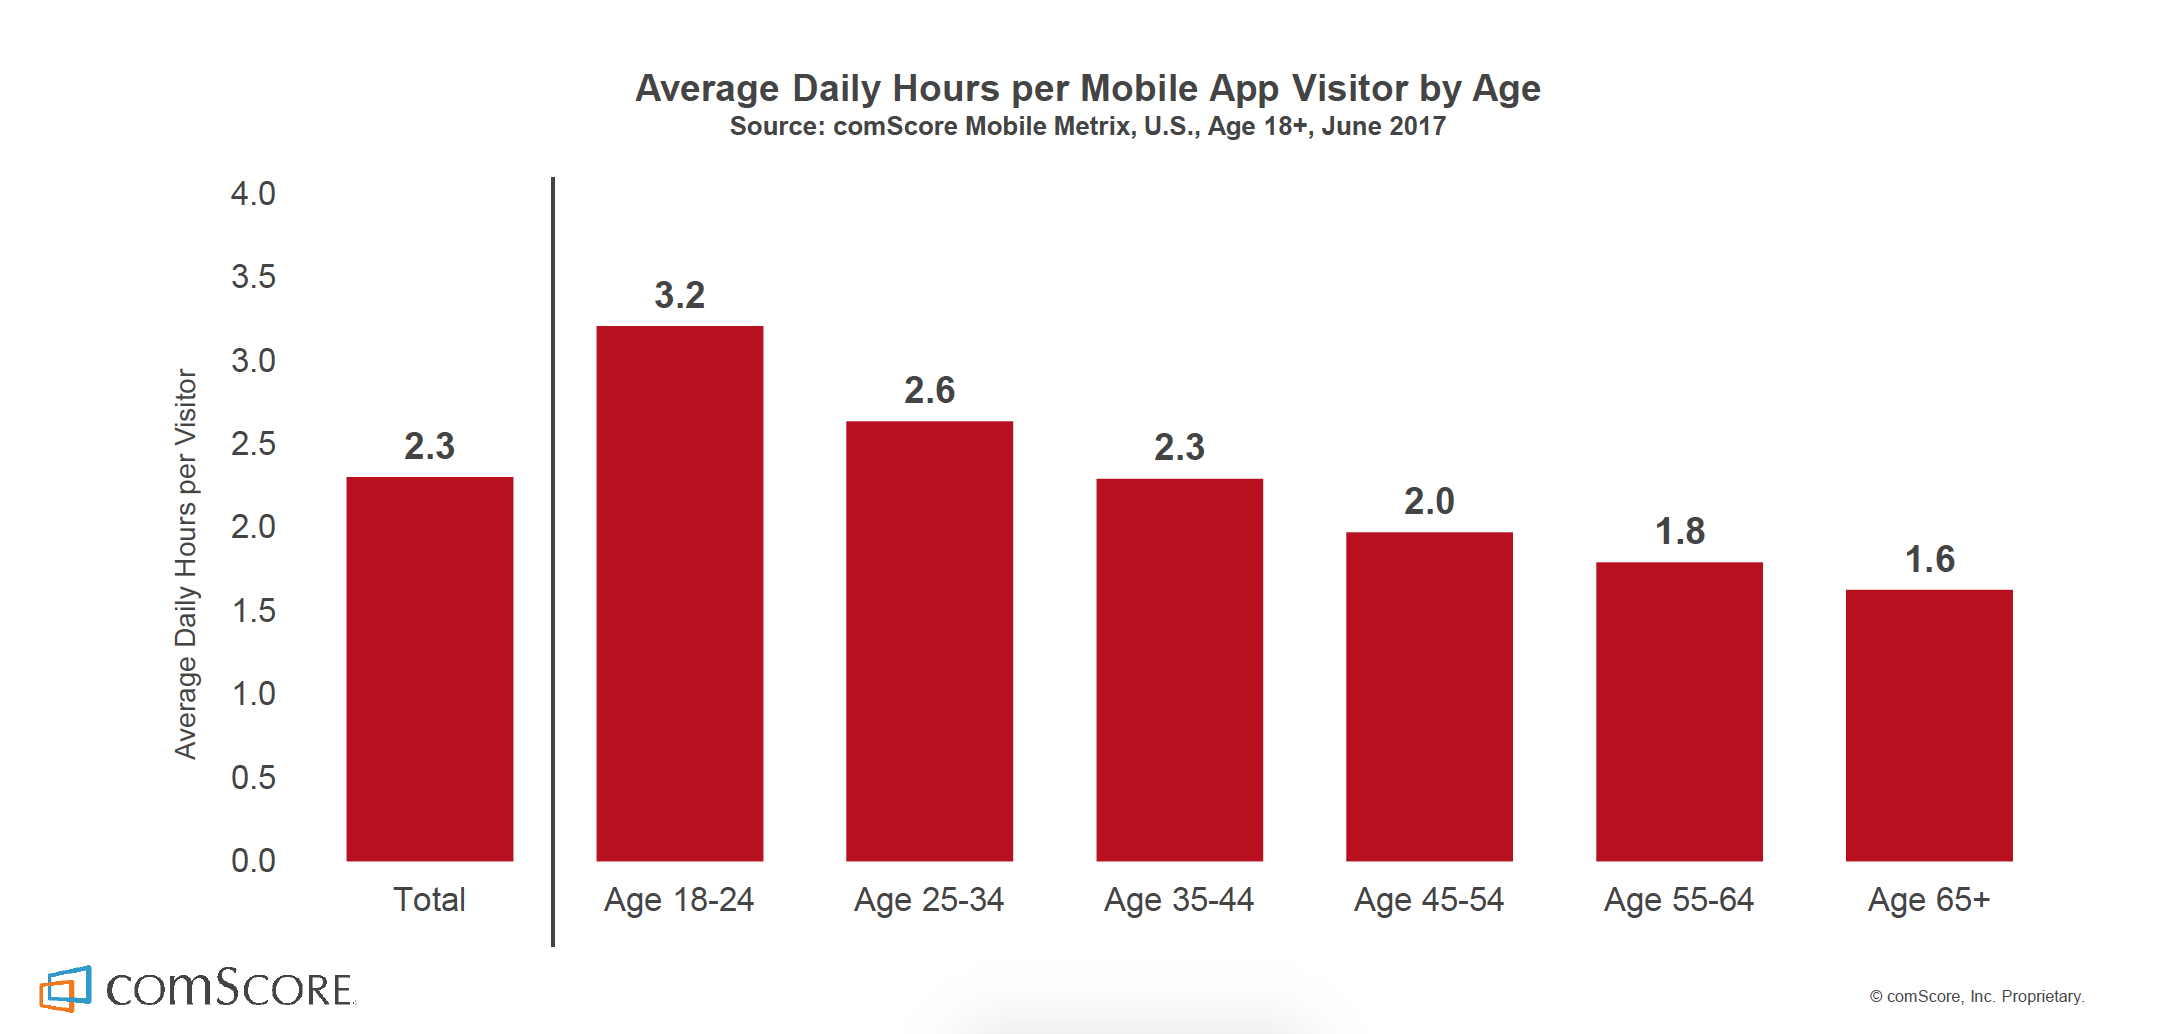
We spend a lot of time on mobile:
2.3 hours. 140 minutes. 9% of our day. However way you cut it: Americans spend a lot of time engaging with our phones and it’s not localized to teenagers or millennials – according to comScore, a media measurement and analytics company, even adults over the age of 65 spend more than 90 minutes a day sliding, swiping and tapping on mobile. Dinner tables everywhere cringe.
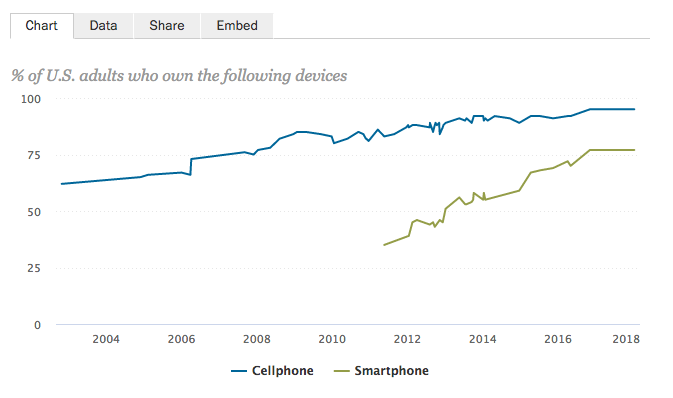
Everyone is on mobile:
The 2018 Pew Research Mobile Factsheet found the following stats for U.S. adults:
77% own a smartphone
83% in urban areas own a smartphone
89% between the ages of 30-49 own a smartphone
46% above the age of 65 have a smartphone.
12% (more than one-in-ten American adults!) are “smartphone-only” Internet users – meaning they own a smartphone and do not have traditional home broadband service.
If communicating effectively and widely with customers is a goal for utilities, this Pew Research data indicates that mobile is the best tool.
Customers prefer digital:
In 2017, JD Power & Associates published a Water Utility Residential Customer Satisfaction Study, which found three of the top five preferred communication channels among customers are digital (text message, blog, social media). Furthermore, “communicating [with the customer] once per month maximises satisfaction” and recall frequency.
In the era of paper and post, frequent “unnecessary” communication might appear daunting and expensive. But today’s tools make it easy for staff of all technical skills to cost efficiently deliver the right message to the right customers through the right channel at the right time. If customer satisfaction is important to the utility, a digital strategy must be in place.
What does our experience tell us about customer use?
There’s a rhythm to engagement:
At Dropcountr we’ve found portal engagement – outside of utility alerts and messages – tend to occur on 14-day cycles: often after a bill is received by the customer and generally halfway through the billing period.
Seem high? More frequent than expected? This is likely because many web portals launched by utilities are rarely updated, difficult to access, and antiquated. A lack of resources or apparent need often leads to poorly designed portals and the challenge of “one-and-done” – when a customer registers for a service once and then fails to return.
Can you blame them? It can be hard to remember URLs, usernames and passwords. It’s a chronic issue not limited to utilities and a primary reason why we built Dropcountr as a native mobile app – easily available anytime with the tap of a finger, and guarded behind the phone’s security protocol.
Customer adoption says a lot:
How quickly customers register for a portal is a good indicator of need and interest. Last summer we saw a 30% adoption rate in the first three months of service at a large midwestern utility – heads and shoulder above what’s typically seen among customer billing portals. Our utility partners are thrilled by the traction their investment in Dropcountr has received and our hypothesis is that a customer portal carries a different tone than a billing portal – one is for support and empowerment, the other a means of collection.
Neighbors talk:
While building the heatmap view for utility staff we found a curious trend among households located in cul-de-sacs: customer adoption was viral month-on-month in environments where neighbors frequently interact. This adoption was during a period of zero outreach and repeated across several communities, indicating neighbors were talking with each other about their Dropcountr account.
This fascinating, observable insight indicates that utility customers are actively interested in managing personal water use; enough so that they would promote a solution like Dropcountr to their neighbors. This anecdote, paired with routine customer satisfaction surveys results, demonstrate that utility customers are not only ready, but desire a digital portal.
What it means for the utility
The new customer playbook writes itself: satisfaction is the goal, communication and ‘services’ the means, digital the preference and mobile the platform of choice.
The rising tide of customer wants and expectations shouldn’t be viewed as a burden. Yes, staff are being asked to do more with less, and yes, utilities are expected to deliver services beyond the meter. But the digital frontier provides tools and levers that demonstrably improve customer communication, giving utilities an opportunity to engage with customers in meaningful ways that are relatively low cost and user friendly.
[wpforms id=”111″]