Dropcountr’s goal from the start has been to present your water usage in a way that provides insight and prompts action – and helps you save water and on your monthly bill.
And you do, to the tune of an impressive 7.8%. And yet many residents still finish the month in disbelief:
“How did I possibly use that much water?”
Answer – inconspicuous water use adds up quickly. Our team frequently makes product tweaks here and there, but this month’s My Water updates (and more) reflect a significant change to the way we contextualize your routine water use. And it is in this reservoir of routine and inconspicuous usage that we expect you to find significant repeatable savings.
Behavioral Patterns
Humans develop patterns, and act cyclically. And our water usage reflects that, whether it’s hour of day (“7a school day showers so the kids are on their way by 8a”) or day of week (“sprinklers run on Tuesdays and Thursdays”).
Attitude shifts have changed the way people actively understand their water use, but what about when people are not thinking? Is this why residents still finish the month asking: “How did I possibly use that much water?”
Painting the picture with more detail
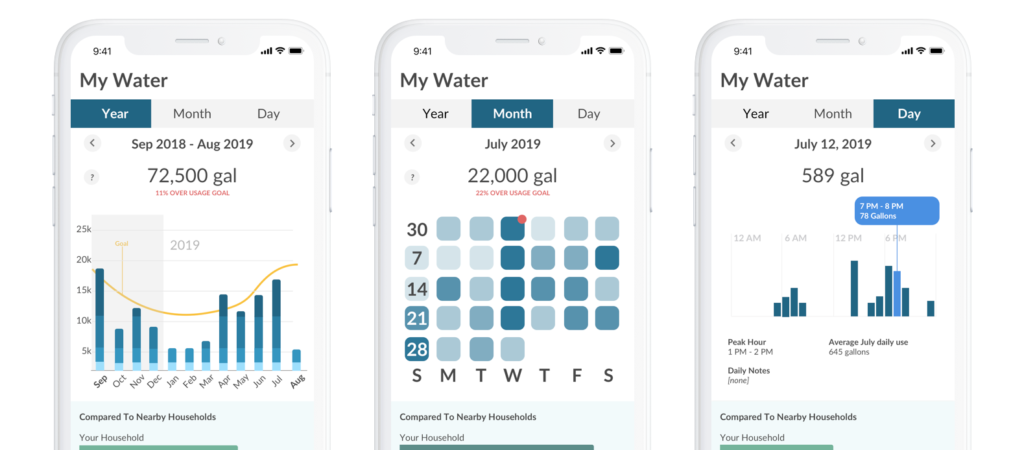
The way we previously presented your usage clarified what and when, but there remained a disconnect in how or why. A yearly perspective illustrates seasonal changes, but is too broad and historical to inform your day-to-day. An hourly perspective helps with an irregular appliance leak, but is often too narrow to identify recurring consumption or behaviors.

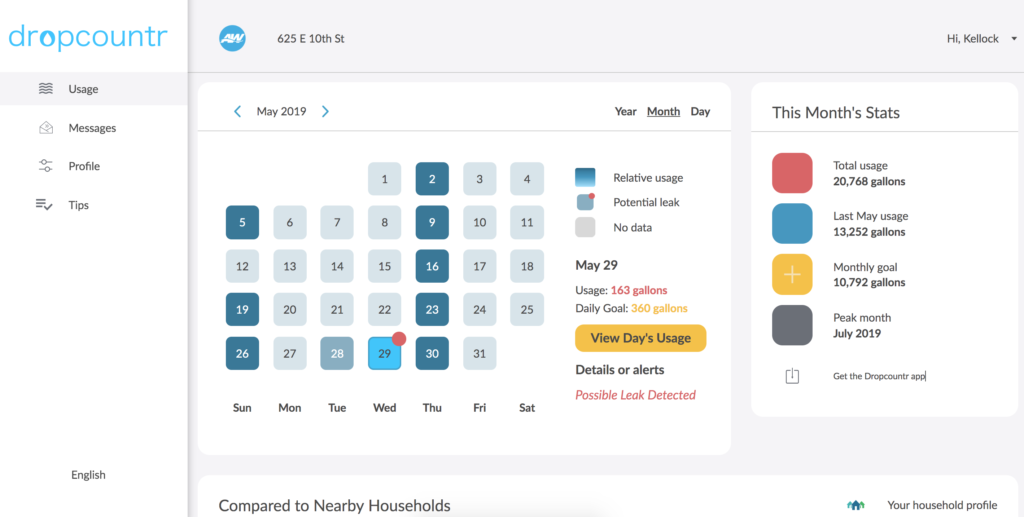
Our new month view provides a middle ground between the broad and the narrow, and its format mirrors the way you think about and act on the rest of your life – like a calendar. Dark squares represent days with significant usage, relative to your overall monthly usage. And vice versa. Never before has it been easier to identify water usage patterns in the micro and the macro.
Can you find a pattern in your usage?
We don’t expect everyone to use Dropcountr daily. But when you do, or receive your monthly report, you should be able to understand your own behavior and act decisively. Our updated design provides clues that help you act early, leading to greater compounding rewards.
A couple notes on what else you’ll find in this month’s updates. The links below will take you to the appropriate section if you’re logged in, or to the log in page if you’re not.
- An updated Tips page to help you better understand and apply incremental changes to water use around the house. Link
- A new daily Details section, where usage or appliance signatures like leaks are catalogued and brought to your attention. Link
- New threshold alerts in your notifications screen, to provide a friendly heads-up when you’ve exceeded a personal budget during a billing period. Further refinements to your household profile also provide an equitable goal for your household. Link
- We’re improving our active alerts and reports to better inform your household about regular and irregular usage, delivered to your phone and email anytime, anywhere.
Thank you to everyone – residents, utility staff, academics – who volunteered their time to bring these design updates to fruition. This is the last time you’ll hear from us this year – the next time will be in 2020, a new decade! We are grateful to you and for your constructive feedback.
Kellock + Team Dropcountr

